

Oregon Taxes for Upcoming Ballots
With the elections upcoming and inflation at record highs, Americans turn their attention to ways to save money. This includes their tax plan as well.
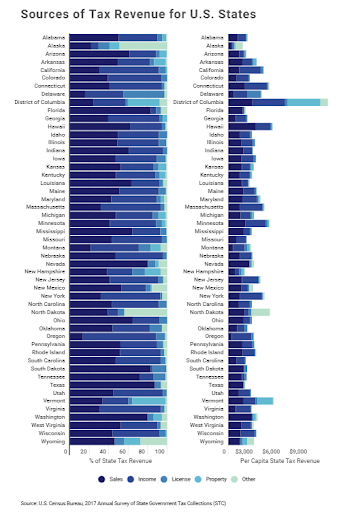
In addition to $3.3 trillion in federal taxes, in 2018 Americans paid $950.5 billion in state taxes distributed across sales, income, property, license, and other taxes. Across all states, sales and gross receipts taxes were the largest source of state tax revenue, followed closely by income taxes; however, the breakdown of tax revenue by state varies widely.
Most Americans are aware that their pocketbooks will be affected differently depending on what part of the country they live in, but few understand just how their hard-earned dollars are converted into funds used to support state education, health care, transportation, and other public services. How states choose to collect taxes impacts both the amount that citizens have to pay every year and the primary vehicles through which they pay them.

Some states rely on income taxes as their primary method for taxing their residents, while other states impose larger sales or property taxes. U.S. Census data shows that Oregon, for example, collects just 13.4 percent of its revenues from sales and gross receipts tax, while the same tax accounts for 87.4 percent of Texas’ state collections. North Dakota extensively taxes natural resource extraction via its severance tax, accounting for nearly 44 percent of the $3.5 billion in taxes the state collected in 2017. New York, on the other hand, collected a full 61 percent of its $79.7 billion in taxes from income tax alone. To better understand the largest sources of tax revenue for each state, researchers at Lattice Publishing analyzed data from the Census Bureau’s 2017 Annual Survey of State Government Tax Collections (the Newest Available Data). Its researchers calculated per capita tax amounts across the survey’s broad taxation categories: income, property, sales and gross receipts, licensing, and ‘other’.
Given the wide range of tax policies from state to state, it can be extremely difficult to determine how much you’d pay in total from one state to another, but for now, here’s the breakdown of our state.

Oregon’s largest source of tax revenue is Income tax, at an average of $2,175 per person, (75.6% of total). The rest were as follows. Total taxes: $2,876 per person, Sales and gross receipts taxes: $386 per person (13.4% of total), Property taxes: $5 per person (0.2% of total), License taxes: $258 per person (9% of total), Other taxes: $52 per person (1.8% of total).